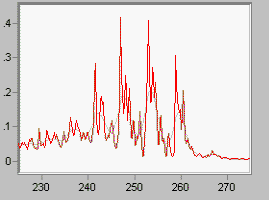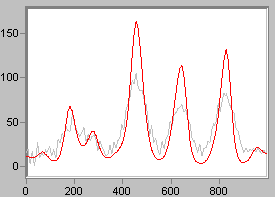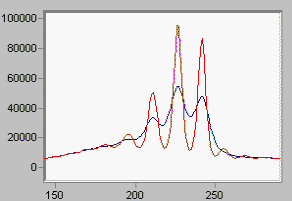


Deconvolution, removing instrumental broadening, need not be an untamed operation with many different answers. Clearly the desired result is not the largest spectrum, nor the smallest, nor the prettiest, but the most likely spectrum that a better instrument with a narrower bandpass would produce. So we construct a function which maximizes that probability. We ask for the most likely output that a hypothetical "better instrument" would produce. The resulting algorithm depends upon the noise statistics, which may be either Gaussian, signal-independent (additive), or Poisson, signal-dependent (counting event). It also contains other explicit constraints (for example, positivity) which the nature of the data requires. The most common of these is the informational entropy of the output spectrum, which should be maximized if the result is to be a maximum entropy spectrum. The constraint of the broadening function of the instrument that took the data is obviously also needed. The better this is known the better the results.We offer four deconvolution functions, DEC, LUC, ASH and LME. Two of them, DEC and LME, are Maximum Entropy deconvolution functions specifically tailored for data with gaussian noise statistics, such as infra-red. Two are Maximum Likelihood deconvolution methods for data with Poisson (counting) noise statistics, such as encountered in xray spectroscopy. One of the Maximum Entropy functions accepts a Bayesian prior.
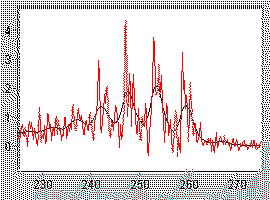
Linear deconvolution is sometimes useful because it is fast, and does not enforce positivity. Not every spectroscopy is positive! (Think of first derivative NMR data). LME is the linear form of the Maximum Entropy function DEC. If you want a linear algorithm that is not iterative, and permits negativity (all linear algorithms do), this is the way you should go. Noise is properly accounted for.
|
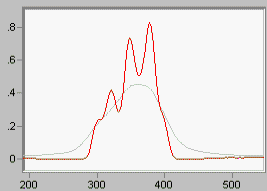
Fig 5 shows the same data as Fig 1, with the output of LME overlaid. |
|
Many other deconvolution algorithms are known. One class allows you to fiddle with the constraining parameters until you get something you like. Fourier Self-Deconvolution is an example. Avoid these, all of them. Most of them take no account of noise. They permit you to get about any spectrum you want out of your data, so you have to know the answer before you ask the question, or you may get garbage. But if you know what the spectrum should look like, why even take data? The purpose of data processing of any kind is to improve your state of knowledge.
