![]()
![]()
![]()
![]()
![]()
![]()
![]()
![]()
![]()
![]()
![]()
|
|
![]()
Introducing QPeaks
for mass spectrometry.
| Find peaks and measure peaks in mass spectrometry data files. | |
| Detect all peaks above a user-specified signal-to-noise ratio. | |
| Assign peaks based on Normal gaussian noise, or Poisson noise statistics. | |
| Qpeaks automatically perfoms a Levenberg-Marquardt fit to find most probable peak masses. | |
| Creates a table of peak parameters, including centroid positions and apex positions. | |
| Table values are presented with their standard errors - and peak signal-to-noise ratios. | |
| Can also perform automated baseline removal in conjunction with the peak finding. |
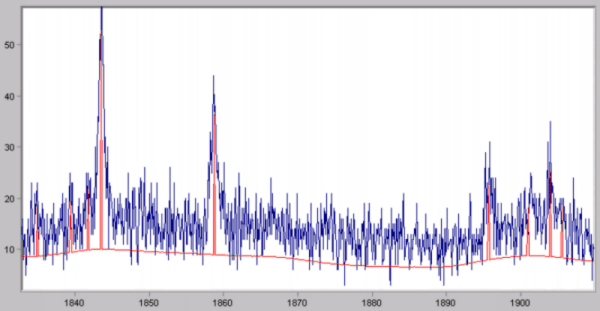
Peak
Finding on spectra with good signal to noise is easy.
QPeaks
will extract peaks, and assign peak significance,
under the
toughest conditions.
QPeaks uses Razor Library functions.
QPeaks is a new algorithm tailored for finding peaks in mass spectrometry. It uses Razor Library’s peak picking function rzrpic to find peaks in a spectrum, then calls upon Razor’s peak fitting function rzrfit to find the best-fit parameters (position, height, width) of the identified peaks.
Faster and easier than Razor Library.
QPeaks is faster, more flexible, and easier to use than standard Razor Library functions. It is faster because it processes the mass spectrum by sections, rather than all-at-once. It is more flexible because it handles data from both (a) spectrometers that operate at constant peak width (delta_mass) and (b) spectrometers that operate at constant resolution or resolving power (mass/delta_mass). (Razor Library peak-finding functions all operate in constant width mode). QPeaks is easier to use than the Razor Library because all the programming details are automatically handled behind-the-scenes within the new RazorQPK DLL.
QPeaks output include peak parameter table and peak position arrays.
QPeak output includes (1) a table listing the found peaks and their parameters, and (2) an array showing the positions and amplitudes of the found peaks, as well as the found baseline (if requested).
 Try QPeaks on your data.
Free offer!
Try QPeaks on your data.
Free offer!
Send us your mass spectrometry data file (ASCII x,y format). We will find the mass peaks in your data and send you (1) a report showing the peaks found by QPeaks, and (2) the output table containing peak masses, amplitudes, and areas. Please send us your toughest mass spectrometry files - the data that makes your current peak finder choke and sputter.
How to get QPeaks for your applications.
Send us one or more mass spec data files. We invite you to send a typical spectrum, and a pathological or worst-case sample. If you like the results that QPeaks gives you, order a PC version of Razor Library, and tell us to include the QPeaks application with your order. Current owners of VC++ Razor Library may also take advantage of this offer.
Last modified 15 March 2002